
The Excel 2010 power query tab
This module introduces:
- the Excel 2010 Power Query tab
- the Excel 2016 Data tab item that replaces the Power Query tab
- a list on other ribbon tabs from Excel 2010 (and Excel 2016)
Power query
Power Query was introduced in Excel 2010 as a COM add-in.
Its availability depended upon:
- System requirements: Microsoft Office 2010 Professional Plus with Software Assurance. For Excel 2013 see https://www.microsoft.com/en-au/download/details.aspx?id=39379 [Accessed 16 February 2017]
- Download the add-in from https://www.microsoft.com/en-au/download/details.aspx?id=39379 [Accessed 16 February 2017]
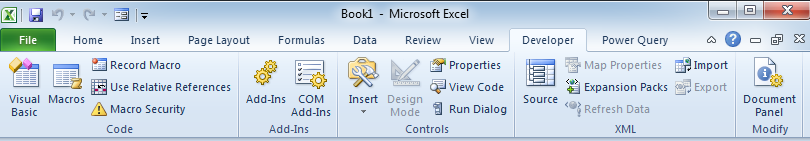
- After installation the Power Query tab is added to the ribbon (figure 1a)

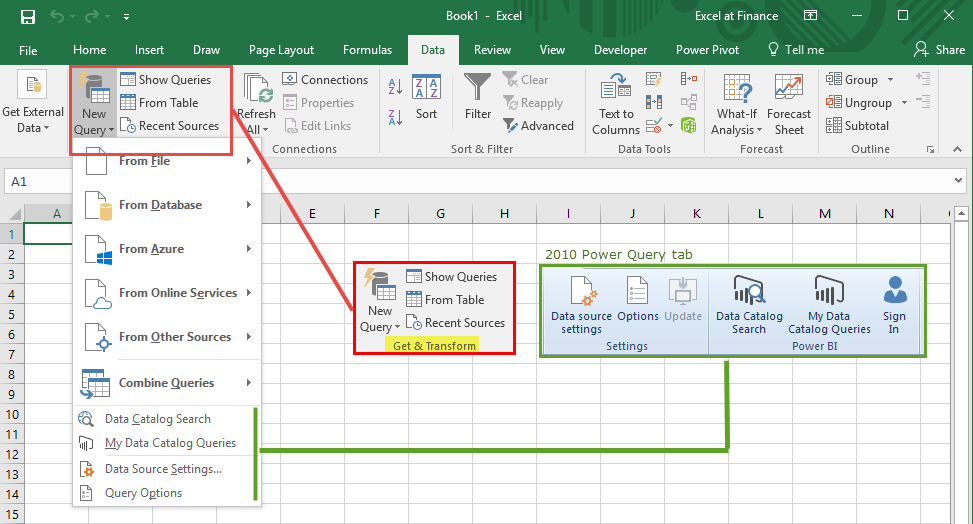
In Excel 2016, the Power Query tab has been integrated into Excel and is available in the Get & Transform group on the Data tab (figure 1b). It is no longer an add-in.
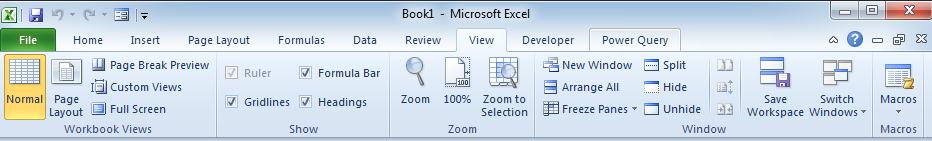
Other Excel 2010 (and Excel 2016) ribbon tabs
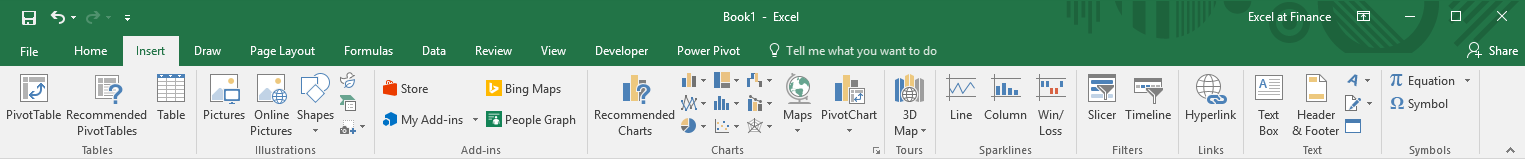
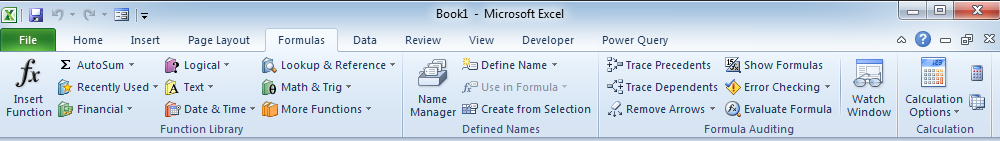
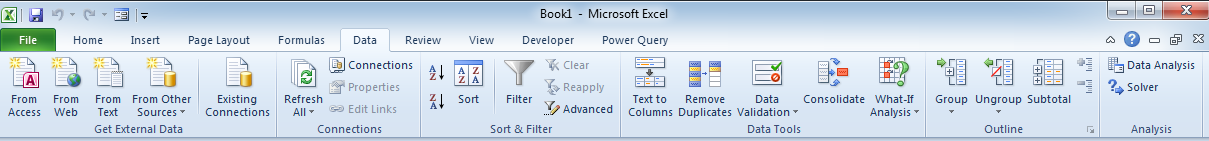
The following list of ribbon tabs is provided for comparison purposes. Click the image for a full scale view.


- This example was developed in Excel 2010 (32 bit) on Windows 7 (64 bit) (except for figure 2), and Excel 2016 (64 bit) Office 365 ProPlus on Windows 10
- Revised: Saturday 25th of February 2023 - 10:12 AM, [Australian Eastern Time (AET)]