
Triangle numbers
0. Preliminary
Exercise
Write a function to find the triangle sum of any positive integer. The triangle sum of \(n\) is the arithmetic sequence \(1 + 2 + 3 + \dots + (n-1) + n\).
Additional information in this module
VBA skills:
- loops - the For...Next construct
- writing function procedures
What is meant by the "triangle sum"?
"A triangular number or triangle number counts objects arranged in an equilateral triangle" (Source: Wikipedia 2017)
Let \(n\) represent the number of dots on one side of the triangle, then the triangle number \(T_n\) has the formula $$\begin{equation}T_n=\sum_{k=1}^n = 1+2+3+\dots +(n-1)+n\end{equation}$$ see figure 1 were the dots on one side of the triangle can be envisaged as rows of dots of the same colour.
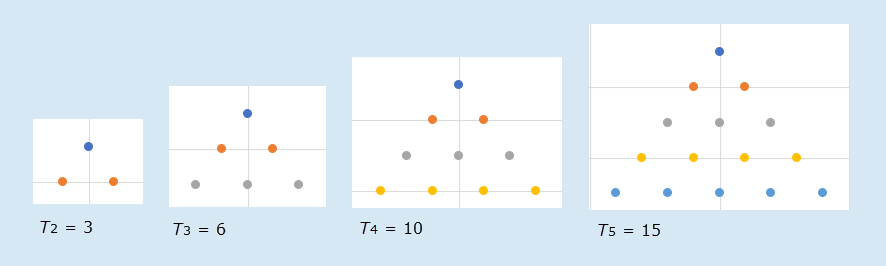
The sequence continues in figure 2.
1. Suggested solution
Code 1: Macro
Triangle write the data range for triangle n
Function Triangle(n As Long) As Long

'   This function calculates the triangular sum of a positive number

    Dim x As Long, y As Long

    y = 0
    For x = 1 To n
        y = y + x
    Next x
    Triangle = y

End Function
' Version 2 with error trapping for non positive n

Function Tri2(n As Integer) As Variant

Dim x As Long, y As Long

    If n < 1 Then
        Tri2 = CVErr(xlErrValue)
    Else
        y = 0
        For x = 1 To n
            y = y + x
        Next x

        Tri2 = y
    End If

End Function
Code 1 - discussion:
- Question: What is the purpose of the code in Line 7:
y = 0?. - Answer:
y = 0is an initialization statement where the y variable is explicitly assigned a zero (0) value. The initial value of the variable is the starting value of the variable. - The variable
yis declared in line 5 as type Long. Although a Long data type has a value of zero by default, the initialization code emphasizes this point and explicit 0 is in line with the description of a "sequence of triangular numbers", namely 0, 1, 3, 6, 10, 15, … (sequence A000217 in the OEIS). The statement has no impact of the code's operation, and is included for readability - Variable initialization of loop elements is demonstrated in Walkenbach (2007) p370
' Initialize
        y = 0
Line 7 could be written as:
2. Creating the triangle charts in Excel
A minimum of three data points \(n => 2\) are required to create a triangle X Y chart.
2.1 Equilateral Triangle
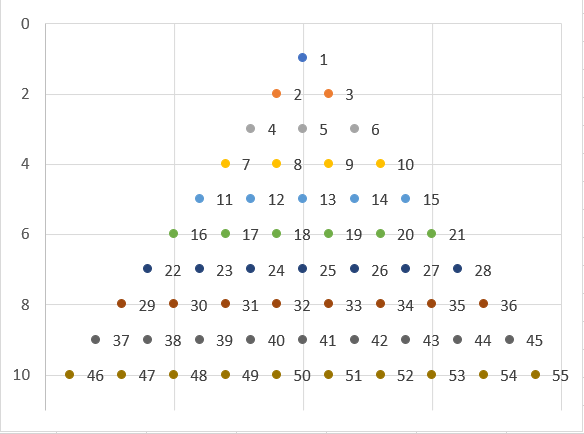
The chart in figure 3 is an Excel X Y scatter chart with 10 rows. You can click the chart to view the data set.

Create the data set
The data points for the chart in figure 1 were written to the worksheet with the TriangleData macro in code 2.
Code 2: Macro
TriangleData write the data range for triangle n (min 2)
Sub TriangleData()

'     #
'    # #
'   # # #
'  # # # #

' interface connectors
Const n As Integer = 10
Const AnchorRef As String = "B4"

Dim x As Integer, y As Integer
Dim Anchor As Range
Dim Mid As Integer
Dim Max As Integer

    Max = n * 2 - 1                     ' x axis 1 to Max (an odd number)
    Set Anchor = Range(AnchorRef)

    ' write x vector
        For x = 1 To Max
            Anchor(x, 1).Value = x
        Next x

        Mid = (Max + 1) / 2             ' mid point of x vector

    ' write y vectors
        For y = 0 To n - 1
            For x = Mid - y To Mid + y Step 2
                Anchor(x, y + 2).Value = y + 1
            Next x
        Next y

    ' select x-y data set (reverse order in chart axis)
        Range(AnchorRef, Cells(x + 1, y + 2)).Select

End Sub
Add the X Y (scatter) chart
To add the X Y chart:
- Select the data if not already selected by line 35 of code 2
- On the ribbon, select Insert > Charts > Scatter - the new chart will appear to be inverted with the point of the triangle at the base
- Right click the chart to display the (Chart Area) context menu and select Format Chart Area ... to display the Format Chart Area pane, then select Chart Options ▼ Vertical (Value) Axis item
- In the Axis Options section, tick
- Adjust other format settings as appropriate
2.2 Lower Triangle
This version of the triangle is relevant to aspects of finance such as the portfolio variance-covariance matrix.

Create the data set
The data points for the chart in figure 2 were written to the worksheet with the TriangleData2 macro in code 3.
Code 3: Macro
TriangleData2 write the data range for triangle n (min 2)
Sub TriangleData2()

' #
' # #
' # # #
' # # # #

' interface connectors
Const n As Integer = 10
Const AnchorRef As String = "B24"

Dim x As Integer, y As Integer, z As Integer
Dim Anchor As Range
Dim Max As Integer

    Max = n * 2 - 1                     ' x axis 1 to Max (an odd number)
    Set Anchor = Range(AnchorRef)

    ' write x vector
        For x = 1 To Max
            Anchor(x, 1).Value = x
        Next x

    ' write y vectors
        For x = 1 To Max Step 2
            z = z + 1
            For y = z To n
                 Anchor(x, y + 1).Value = y
            Next y
        Next x

    ' select x-y data set
        Range(AnchorRef, Cells(x + 1, y + 2)).Select

End Sub
To add the X Y chart, follow the steps in section 2.1.
3. Finance aspects
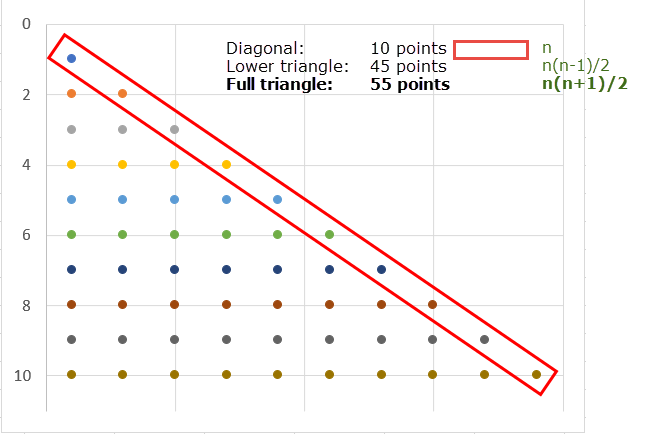
Equation 1 can be written as \(n(n+1)/2\) as shown in equation 2 $$\begin{equation}T_n=\sum_{k=1}^n=1+2+3+\dots +(n-1)+n=\frac{n(n+1)}{2}=n(n+1)/2\end{equation}$$ For \(n = 10\), \(T_{10} = (10 \times 11)/2 = 55\)
The lower triangle in figure 2 is equivalent to a lower triangle of a variance matrix. For a 10 asset portfolio there are 55 variance-covariance items. The number of portfolio covariance terms, items off the main diagonal is \(T_n-n=55-10=45\) $$\begin{equation}T_n-n =\frac{n(n+1)}{2}-n=\frac{n^2+n}{2}-\frac{2n}{2}=\frac{n^2-2n+n}{2}=\frac{n(n-1)}{2}=n(n-1)/2\end{equation}$$ For \(n = 10\), \(T_{10}-n =(10 \times 11)/2-10=55-10=45\) covariance items (off diagonal) and \(10\) variance items (on diagonal) - see figure 5.
Other applications in finance include, Pascal's triangle, and binomial trees.
- References
- Excel at Finance: Convert a lower triangular table to full matrix Accessed: 4 November 2017
- Walkenbach J (2007), Excel 2007 Power Programming with VBA, Wiley
- Wikipedia: Triangular number Accessed: 4 November 2017