
xlf EandA series
Chart interface - on-sheet controls
0. Preliminary
The EXERCISE - implement the following
Part A Sub procedures
Insert a Code Module and name it PartA
A.1 Write a Public Sub procedure to assign the integer 2016 to a public variable named Yr in the code module
A.2 Develop a user interface with the following functionality:
- The interface is made visible from an on-sheet control on the worksheet with tab position one. The interface activation code will pass the value in Yr to your code procedure
- The interface will give the user the choice of displaying one, two, or three charts, either all on the worksheet, or all on chartsheets
- The data test period is applied to the ANZ data set
- Three charts:
- Open High Low Close (OHLC)
- Price Volume (PV), and
- Return. The return series will be generated with the Price2Return function from part b
A.3 The interface will only function if the Yr variable has a value within the range of the ANZ data date vector
1.Understanding the question
![]() Develop a user interface - at first glance this may suggest a User Form based interface. Before we rush in, however, lets look at the question a little more closely.
Develop a user interface - at first glance this may suggest a User Form based interface. Before we rush in, however, lets look at the question a little more closely.
Here are some important points:
- Part A refers to "Sub procedures". These procedures are generally written in as ordinary code module (Modules), and not in a Forms module
- Moreover, you are required to "insert a Code module and name it ...". This is an ordinary code module (Modules) and not a Form(s) module
- In addition, aspects of the question are similar to the session xlf EXERCISES. This exercise, parts of which were demonstrated in class, covers "The interface activation code will pass the value in Yr ..." from part A.2 a. The exercise develops an on-sheet interface, albeit, with less functionality than the current task
![]() Not a UserForm, then must be onsheet - this suggests the use of Developer > Controls > Insert > ... Form Controls and / or ActiveX Controls in an on-sheet setting. After some initial planning the interface controls can be identified, working names allocated, and a mixture of Form and ActiveX selected based on functionality and ease of implementation.
Not a UserForm, then must be onsheet - this suggests the use of Developer > Controls > Insert > ... Form Controls and / or ActiveX Controls in an on-sheet setting. After some initial planning the interface controls can be identified, working names allocated, and a mixture of Form and ActiveX selected based on functionality and ease of implementation.
The interface components:
- The on-sheet control from part A.2 a, named the Chart caller
- The user interface from part A.2, named the Chart selector
- The Excel charts, whether on a worksheet or chartsheets
Points 1 and 2 require the most explanation and are the focus of this version (v1) of the module. The on-sheet control and user interface are collectively named the Charter interface.
2.Chart interface
2.1 Interface preview
To point the way, a preview of the Chart interface appears in figure 1.
The components list - from code 7 below
' CHART SELECTOR
'
' Form controls        === === ===
'   TextBox: Rectangle Main
'   TextBox: TextBox Header
'
'   Group Box: Group Box ChartType
'   Group Box: Group Box ChartLocation
'   Group Box: Group Box Returns
'
' ActiveX controls     === === ===
'   CheckBox: chkOHLC
'   CheckBox: chkPV
'   CheckBox: chkRet
'
'   OptionButton: optWS
'   OptionButton: optCS
'
'   OptionButton: optLog
'   OptionButton: optDelta
'
'   CommandButton: cmdUpdate
'   CommandButton: cmdClose
'
'   OptionButton: opt2016
'   OptionButton: opt2015
'
' Other
'   Image: Picture xlf logo
' ================================
'
The components list - from code 8 below
' CHART CALLER
'
' Form controls        === === ===
'   TextBox: Rectangle Caller
'   TextBox: Header Caller
'
' ActiveX controls     === === ===
'   CommandButton: cmdCharter
' ================================
'
1.2 Interface workbook initialize
Code 1:
cmdCharter_Initialize macro
Option Explicit

Private Sub Workbook_Open()

    Yr = 2016
    Application.Run "PartA.cmdCharter_initialize"

End Sub
About code 1
- Line 4: Assign a value to the Yr variable. Task A. 1
- Line 5: Set the initial values for the Chart selector, including the year
3. Chart code
[PartA (Code)] Module
3.1 Initialize Chart selector
Code 2:
cmdCharter_Initialize macro
Option Explicit

Public Yr As Integer    ' populate at WorkBook_Open event
Public LocationWS As Boolean
Public Updated As Boolean

Private Sub cmdCharter_Initialize() ' caller: WorkBook_Open event

    With Sheets(1)
    ' The caller button
        .cmdCharter.Caption = "Display Charter interface [" & Yr & "]"

    ' The interface
        .chkOHLC.Value = False
        .chkPV.Value = False
        .chkRet.Value = False
        .optWS.Value = True
        .optCS.Value = False
        .optLog.Value = True

        If Yr = 2016 Then
            .opt2016.Value = True
        Else
            .opt2015.Value = True
        End If

    End With

    Call HideCharter
    Call UnHideCaller

End Sub
3.2 Hide Caller, and Unhide Selector
Code 3:
HideCaller and UnHideCharter
' ================================
' Part A ii a "The interface is made visible from an onsheet control on the worksheet
' with tab position one. The interface activation code will pass the value in
' Yr to your code procedure"
'
' Procedures
'   HideCaller
'   UnHideCharter
'=================================

Private Sub HideCaller()
' Assume elements are not grouped

    Worksheets(1).Activate
    With ActiveSheet

        .Shapes("Rectangle Caller").Visible = msoFalse
        .Shapes("Header Caller").Visible = msoFalse

        .cmdCharter.Visible = msoFalse

    End With

End Sub

Private Sub UnHideCharter(inYr As Integer)
' Assume elements are not grouped

    Worksheets(1).Activate
    With ActiveSheet

        .Shapes("Rectangle Main").Visible = msoTrue
        .Shapes("TextBox Header").Visible = msoTrue
        .Shapes("Picture xlf logo").Visible = msoTrue
        .Shapes("Group Box ChartType").Visible = msoTrue
        .Shapes("Group Box ChartLocation").Visible = msoTrue
        .Shapes("Group Box Returns").Visible = msoTrue
        .Shapes("Group Box Year").Visible = msoTrue

        .chkOHLC.Visible = msoTrue
        .chkPV.Visible = msoTrue
        .chkRet.Visible = msoTrue

        .optWS.Visible = msoTrue
        .optCS.Visible = msoTrue

        .optLog.Visible = msoTrue
        .optDelta.Visible = msoTrue

        .opt2016.Visible = msoTrue
        .opt2015.Visible = msoTrue

        If inYr = 2016 Then
            .opt2016 = msoTrue
        ElseIf inYr = 2015 Then
            .opt2015 = msoTrue
        End If

        .cmdUpdate.Visible = msoTrue
        .cmdClose.Visible = msoTrue

    End With

End Sub
3.3 Unhide Caller, and Hide Selector
Code 4:
UnHideCaller and HideCharter. This is the REVERSE procedure
' ================================
' Part A ii a "The interface is made visible from an onsheet control on the worksheet
' with tab position one. The interface activation code will pass the value in
' Yr to your code procedure"
'
' This is the REVERSE procedure
'
' Procedures
'   UnHideCaller
'   HideCharter
'=================================

Private Sub UnHideCaller()
' Assume elements are not grouped

    Worksheets(1).Activate
    With ActiveSheet
            If .opt2016.Value Then
                Yr = 2016
            Else
                Yr = 2015
            End If

        .Shapes("Rectangle Caller").Visible = msoTrue
        .Shapes("Header Caller").Visible = msoTrue

        .cmdCharter.Visible = msoTrue
        .cmdCharter.Caption = "Display Charter interface [" & Yr & "]"

    End With

End Sub


Private Sub HideCharter()
' Assume elements are not grouped

    Worksheets(1).Activate
    With ActiveSheet

        .Shapes("Rectangle Main").Visible = msoFalse
        .Shapes("TextBox Header").Visible = msoFalse
        .Shapes("Picture xlf logo").Visible = msoFalse
        .Shapes("Group Box ChartType").Visible = msoFalse
        .Shapes("Group Box ChartLocation").Visible = msoFalse
        .Shapes("Group Box Returns").Visible = msoFalse
        .Shapes("Group Box Year").Visible = msoFalse

        .chkOHLC.Visible = msoFalse
        .chkPV.Visible = msoFalse
        .chkRet.Visible = msoFalse

        .optWS.Visible = msoFalse
        .optCS.Visible = msoFalse

        .optLog.Visible = msoFalse
        .optDelta.Visible = msoFalse

        .opt2016.Visible = msoFalse
        .opt2015.Visible = msoFalse

        .cmdUpdate.Visible = msoFalse
        .cmdClose.Visible = msoFalse

    End With

End Sub
3.4 The Returns vector
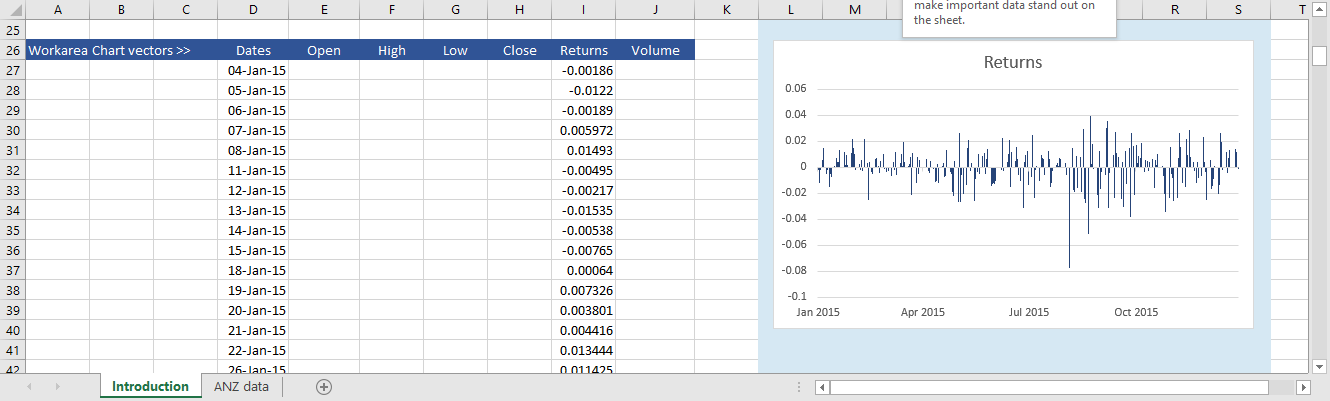
A.2 d 3 "The return series will be generated with the Price2Return function from part b". This is shown in column H of the worksheet in figure 2. Formula =Price2Return(Close,Return) entered as an array (CSE) formula.

3.5 The Charts Dates and Returns vector naming
Code 5:
Yr2015Yr2016 macro
' Charts
' Set data ranges

Private Sub Yr2015Yr2016()
Dim Rng As Range    ' from data base

Dim RName As String ' NAME of data vector

Dim RngName As Name ' reset NAME for chart series

Dim r As Integer, i As Integer
Dim n2015 As Integer, n2016 As Integer

    ' Number of observations
    n2015 = Range("Dates2015").Count
    n2016 = Range("Dates2016").Count

' Dates === ===
    RName = "Dates"     ' name of vector
    Set RngName = Names.Item(RName)

        If Sheet1.opt2015 Then
            Set Rng = Range(RName & "2015")
            r = n2015
        ElseIf Sheet1.opt2016 Then
            Set Rng = Range(RName & "2016")
            r = n2016
        End If

    Range(RName).ClearContents
    Range(RName).Resize(1, 1).Select

        With RngName
            .RefersTo = .RefersToRange.Resize(r, 1)
        End With

        For i = 1 To r
            Range(RName)(i, 1) = Rng(i, 1)
        Next i

    Set RngName = Nothing: Set Rng = Nothing

' Returns === ===
    RName = "Returns"     ' name of vector
    Set RngName = Names.Item(RName)

        If Sheet1.opt2015 Then
            Set Rng = Range(RName & "2015")
            r = n2015
        ElseIf Sheet1.opt2016 Then
            Set Rng = Range(RName & "2016")
            r = n2016
        End If

    Range(RName).ClearContents
    Range(RName).Resize(1, 1).Select

        With RngName
            .RefersTo = .RefersToRange.Resize(r, 1)
        End With

        For i = 1 To r
            Range(RName)(i, 1) = Rng(i, 1)
        Next i

    Set RngName = Nothing: Set Rng = Nothing

End Sub
3.6 The Chart Updater
Code 6a:
ChartUpdater macro
Private Sub ChartUpdater() ' caller cmdUpdate

' Collect settings from interface
    ' Year
        If Sheet1.opt2016 Then
            Yr = 2016
        Else
            Yr = 2015
        End If

    ' Location
        If Sheet1.optWS Then
            LocationWS = True
        Else
            LocationWS = False
        End If

    ' Return
        If Sheet1.optLog Then
            Range("Return") = True
        Else
            Range("Return") = False
        End If
        Sheet1.Calculate

' Display chart
    Call Yr2015Yr2016
    Updated = True

' Other chart code is not included in this version of the document

End Sub
Code 6b:
Sheet1(Introduction) macros
Option Explicit

' Interface command buttons
' Interface caller    === === ===
Private Sub cmdCharter_Click()
    Application.Run "PartA.UnHideCharter", Yr
    Application.Run "PartA.HideCaller"
End Sub

' Interface            === === ===
Private Sub cmdClose_Click()
    Application.Run "PartA.HideCharter"
    Application.Run "PartA.UnHideCaller"
End Sub

Private Sub cmdUpdate_Click()
    Application.Run "PartA.ChartUpdater"
End Sub
4. Maintenance code
Material in this section is not required in the answer to the question, but provides useful details about the interface properties. The objects must exist for this code to function.
4.1 ChartInterfaceReset
Code 7: Procedures in the zMaintenance module
Option Explicit
Const TLC As String = "C4"  ' top left cell - interface anchor
' ================================

Private Sub ChartInterfaceReset()
' ================================
' Requires:
'
' Form controls        === === ===
'   TextBox: Rectangle Main
'   TextBox: TextBox Header
'
'   Group Box: Group Box ChartType
'   Group Box: Group Box ChartLocation
'   Group Box: Group Box Returns
'
' ActiveX controls     === === ===
'   CheckBox: chkOHLC
'   CheckBox: chkPV
'   CheckBox: chkRet
'
'   OptionButton: optWS
'   OptionButton: optCS
'
'   OptionButton: optLog
'   OptionButton: optDelta
'
'   CommandButton: cmdUpdate
'   CommandButton: cmdClose
'
'   OptionButton: opt2016
'   OptionButton: opt2015
'
' Other
'   Image: Picture xlf logo
' ================================

' Anchor cell
Dim Left As Integer
Dim Top As Integer

' Header text
Dim Text2 As String
Dim Text2Bold As String
Text2 = "xlf Chart Interface - demonstrator v1.0"
Text2Bold = VBA.InStr(Text2, " - ") ' number of characters in Text2 ending at "-"


Left = Range(TLC).Left
Top = Range(TLC).Top

    Worksheets(1).Activate

    ' INTERFACE :: textbox === ===
    With ActiveSheet
        With .Shapes("Rectangle Main")
            .Left = Left + 0: .Top = Top + 0
            .Height = 300: .Width = 400
            .Fill.ForeColor.RGB = RGB(214, 232, 243)
        End With


    ' HEADER :: logo, and text ===
        With .Shapes("TextBox Header")
            .Left = Left + 20: .Top = Top + 15
            .Height = 30: .Width = 360
            .Fill.ForeColor.RGB = RGB(55, 95, 146)

            .TextFrame2.VerticalAnchor = msoAnchorMiddle
            .TextFrame2.MarginLeft = 40

            With .TextFrame2.TextRange
                .Characters.Text = Text2
                .Characters.Font.Size = 14
                .Characters.Font.Fill.ForeColor.RGB = RGB(180, 200, 231)
                .Characters(1, Len(Text2Bold)).Font.Bold = msoTrue
                .Characters(Text2Bold, .Characters.Count - Text2Bold).Font.Bold = msoFalse
            End With
        End With

        With .Shapes("Picture xlf logo")
            .Left = Left + 30: .Top = Top + 20

        End With

   ' CONTROL groups    === === ===
   ' GROUP 1 :: Chart type === ===
        ' 1. chkOHLC    >> Open High Low Close
        ' 2. chkPV      >> Price Volume
        ' 3. chkRet     >> Return

        With .Shapes("Group Box ChartType")
            .Left = Left + 20: .Top = Top + 60
            .Height = 140: .Width = 180
        End With


        With .chkOHLC
            .Left = Left + 40: .Top = Top + 80
            .Height = 20: .Width = 140
            .BackColor = RGB(214, 232, 243)
        End With

        With .chkPV
            .Left = Left + 40: .Top = Top + 120
            .Height = 20: .Width = 140
            .BackColor = RGB(214, 232, 243)
        End With

        With .chkRet
            .Left = Left + 40: .Top = Top + 160
            .Height = 20: .Width = 140
            .BackColor = RGB(214, 232, 243)
        End With

   ' GROUP 2 :: Chart location === ===
        ' === GroupName: Location
        ' 1. optWS    >> Worksheet
        ' 2. optCS    >> Chartsheet
        With .Shapes("Group Box ChartLocation")
            .Left = Left + 220: .Top = Top + 60
            .Height = 60: .Width = 160
        End With

        With .optWS
            .Left = Left + 240: .Top = Top + 70
            .Height = 20: .Width = 120
            .BackColor = RGB(214, 232, 243)
            .Caption = "Worksheet"
            .GroupName = "Location"
        End With

        With .optCS
            .Left = Left + 240: .Top = Top + 90
            .Height = 20: .Width = 120
            .BackColor = RGB(214, 232, 243)
            .Caption = "Chartsheet"
            .GroupName = "Location"

        End With


   ' GROUP 3 :: Prices to returns === ===
        ' === GroupName: Return
        ' 1. optLog    >> Worksheet
        ' 2. optDelta    >> Chartsheet
        With .Shapes("Group Box Returns")
            .Left = Left + 220: .Top = Top + 140
            .Height = 60: .Width = 160
        End With

        With .optLog
            .Left = Left + 240: .Top = Top + 150
            .Height = 20: .Width = 120
            .BackColor = RGB(214, 232, 243)
            .Caption = "Log : ln(Pt / Pt-1)"
            .GroupName = "Return"

        End With

        With .optDelta
            .Left = Left + 240: .Top = Top + 170
            .Height = 20: .Width = 120
            .BackColor = RGB(214, 232, 243)
            .Caption = "Delta : (Pt-Pt-1) / Pt-1)"
            .GroupName = "Return"
        End With


    ' GROUP 4 :: Command buttons === ===
        ' 1. cmdUpdate    >> Update charts
        ' 2. cmdClose     >> Close (Hide) interface

        With .cmdUpdate
            .Left = Left + 220: .Top = Top + 215
            .Height = 30: .Width = 160
            .Caption = "Update charts"
        End With


        With .cmdClose
            .Left = Left + 220: .Top = Top + 255
            .Height = 30: .Width = 160
            .Caption = "Close"
        End With


    ' GROUP 5 :: Prices to returns === ===
        ' === GroupName: Year
        ' 1. opt2016    >> Calendar year 2016
        ' 2. opt2015    >> Calendar year 2015
        With .Shapes("Group Box Year")
            .Left = Left + 20: .Top = Top + 215
            .Height = 70: .Width = 180

        End With

        With .opt2016
            .Left = Left + 40: .Top = Top + 230
            .Height = 20: .Width = 120
            .BackColor = RGB(214, 232, 243)
            .Caption = "2016"
            .GroupName = "Year"
        End With

        With .opt2015
            .Left = Left + 40: .Top = Top + 255
            .Height = 20: .Width = 120
            .BackColor = RGB(214, 232, 243)
            .Caption = "2015"
            .GroupName = "Year"
        End With

    End With

End Sub
4.2 ChartCallerReset
Code 8: Procedures in the zMaintenance module
Private Sub ChartCallerReset()
' ================================
' Requires:
'
' Form controls        === === ===
'   TextBox: Rectangle Caller
'   TextBox: Header Caller
'
' ActiveX controls     === === ===
'   CommandButton: cmdCharter
' ================================

Dim Left As Integer
Dim Top As Integer

' Header text
Dim Text2 As String
Dim Text2Bold As String
Text2 = "xlf Chart Interface - demonstrator v1.0"
Text2Bold = VBA.InStr(Text2, " - ") ' number of characters in Text2 ending at "-"


Left = Range(TLC).Left
Top = Range(TLC).Top

    Worksheets(1).Activate

    ' CALLER :: textbox === ===
    With ActiveSheet
        With .Shapes("Rectangle Caller")
            .Left = Left + 0: .Top = Top + 0
            .Height = 100: .Width = 400
            .Fill.ForeColor.RGB = RGB(214, 232, 243)
        End With

        ' CALLER :: text ===
        With .Shapes("Header Caller")
            .Left = Left + 50: .Top = Top + 20
            .Height = 30: .Width = 300
            .Fill.ForeColor.RGB = RGB(214, 232, 243)
            .Line.BackColor.RGB = RGB(214, 232, 243)
        End With

        With .Shapes("Header Caller")

            .TextFrame2.MarginTop = 2
            .TextFrame2.HorizontalAnchor = msoAnchorCenter


            With .TextFrame2.TextRange
                .Characters.Text = Text2
                .Characters.Font.Size = 14
                .Characters.Font.Fill.ForeColor.RGB = RGB(25, 25, 112)
            End With
        End With

        With .cmdCharter
            .Left = Left + 100: .Top = Top + 60
            .Height = 30: .Width = 200
            .Caption = "Display Charter interface [" & Yr & "]"
        End With

End With

End Sub
- Development platform: Excel 2016 (64 bit) Office 365 ProPlus and VBA 7.1
- Revised: Saturday 25th of February 2023 - 10:12 AM, [Australian Eastern Time (AET)]