
IRR gap analysis
This module demonstrates the gap analysis technique and its use in measuring and reporting interest rate risk (IRR) for a financial institution (FI). IRR exists when changes in interest rates impact on the FI's net interest income (NII) for the reporting period. The impact of interest rate changes on the capital value of assets and liabilities is covered under the duration method.
An example balance sheet is shown in figure 1a, Excel Web App #1. The financial data worksheet includes a categorised balance sheet in the range B2:D19 (red border), and associated NII for balance sheet items in column F. Interest rate details and repricing periods are also included.
Interest rate sensitivity
Interest rate sensitivity depends on the time to repricing (change of interest rate) for each asset and liability item. For example, Government bonds (line 4) have a fixed coupon, and interest income is fixed until maturity in five years. A change in market rates in the next 12 months will not change the bond coupon income. On the other hand, the fixed rate loans item matures in 5 months, and new loans issued would then be set to the prevailing fixed rate at that time.
To group items into chronological order of repricing, a time interval, say the next 12 months can be split into intervals, and items repricing in each interval can then be grouped. These time based groups are often called "gap buckets".
Once the repricing reset or maturity point for an item (asset, liability, or off balance sheet) has been identified, it can be slotted, or included in a repricing / time bucket.
The time to repricing for each item in shown in column J of the financial data worksheet
Gap analysis
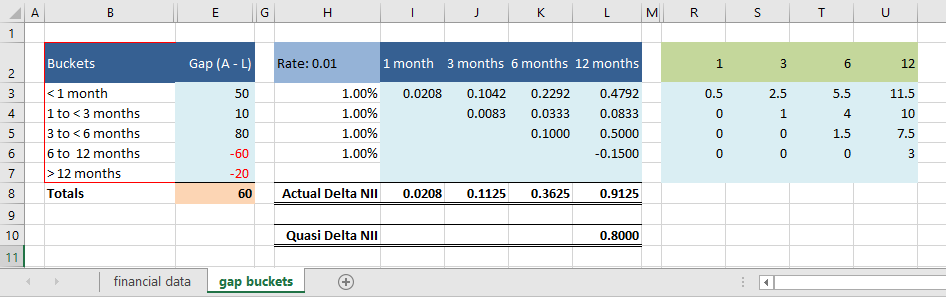
Based on the time to repricing data and dollar values, the categorisation of the bucket groups appear in the gap buckets worksheet, figure 1b, Excel Web app #1. Within each bucket, the gap (assets - liabilities) is shown in column E, and the cumulative gap in column F. Overall there is a positive gap of $60 million (cell E8), but the gap within individual buckets varies considerably. Three to < six has a positive gap of $80 million (cell E5), whilst six to < 12 has a negative gap of $60 million (cell E6).
The change in net interest income ΔNII
- A positive gap implies an increase in NII when market rate increase
- Suppose that interest rates increase by 1 percentage point, and the increase is equal for assets and liabilities, and across the yield curve
- The dollar amount of the increase for an overall positive gap can estimates techniques including:
- The "Quasi steady state" method and its estimate on the annual ΔNII, and
- "Actual annual change" method and its estimate on interval ΔNII and cumulative interval ΔNII
Quasi steady state ΔNII
- \(\Delta NII = CumGap \times \Delta r = 80 \times 0.01 = 0.8 \)
Actual annual ΔNII
Assumptions:
- On average, the rate change occurs half way through the time buckets, at the mid point. See columns N to P (figure 1b) for the Lower, Upper, and Bucket mid point values.
- The change of interest rate only impacts on the remaining time in the time bucket (see figure 2, columns R to U)
- The actual change in NII can be estimated at any of the time bucket end points
- The maximum interval is 12 months because the notion of NII is an annual concept
Worked calculations (sample)
- \(\Delta NII_{1mth} = 50 \times 0.01 \times (1.0 - 0.5)/12 = 0.0208 \)
- \(\Delta NII_{3mths} = 50 \times 0.01 \times (3.0 - 0.5)/12 + 10 \times 0.01 \times (3.0 - 2.0)/12 = 0.1125 \)
The results for the actual change in NII are given in cells H8:L8 of the gap buckets worksheet (figure 1b), and also shown in summarised form in figure 2.
- This example was developed in Excel 2016 Pro 64 bit.
- Click the Excel Web App download button to download the worksheet
- Development platform: Excel 2016 Pro 64 bitPublished: 15th September 2016
- Revised: Saturday 25th of February 2023 - 09:37 AM, [Australian Eastern Standard Time (EST)]